Managing patient sample workflow
Patient sample entry to result generation - A complete end-to-end solution for patient sample tracking in labs
Challenge
In diagnostic labs, technicians process dozens of patient samples daily through a multi-step testing workflow. Without a digital system, they relied on handwritten notes and spreadsheets to track which sample is where, leading to costly mix-ups, wasted materials, and delayed results.
Solution
We designed AVENIO Connect, a workflow management tool that guides lab technicians through every step, from registering patient samples to generating final results. The application tracks each sample's status in real time, replacing error-prone manual methods with a clear, guided digital process.
Our users - Personas
Our primary user is a lab technician in an NGS (next-generation sequencing) lab, where patient DNA samples are analyzed to detect diseases. They process 20-50 patient samples daily, juggle multiple instruments, and rely on precision to deliver accurate diagnostic results. They typically have a background in molecular biology or biochemistry, and work across sample preparation, sequencing, and data analysis.
Design process
Understanding the problem
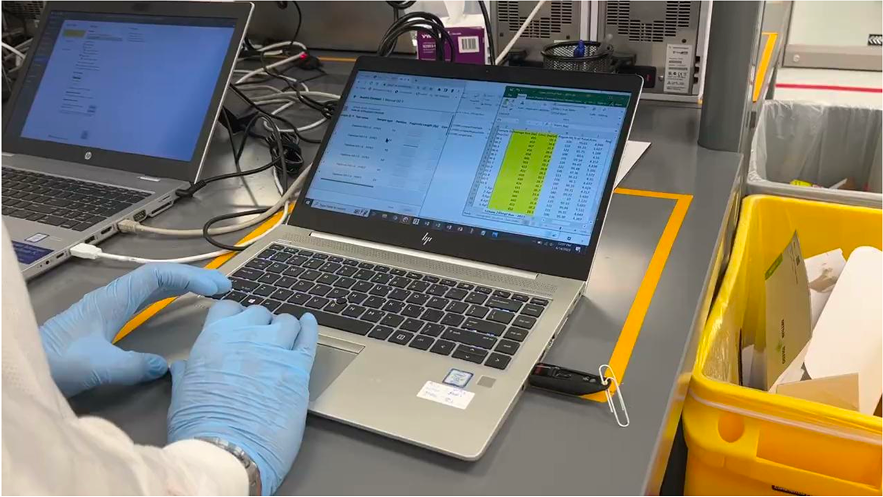
Lab users in an NGS lab face difficulties in efficiently tracking and sharing critical information about patient samples, such as sample container IDs, Run IDs (unique identifiers for each test cycle), and sample IDs, during the various workflow steps involving different lab instruments. The current method of using spreadsheets and physical notes is time-consuming and prone to errors, leading to potential miscommunication and delays in the lab workflow.
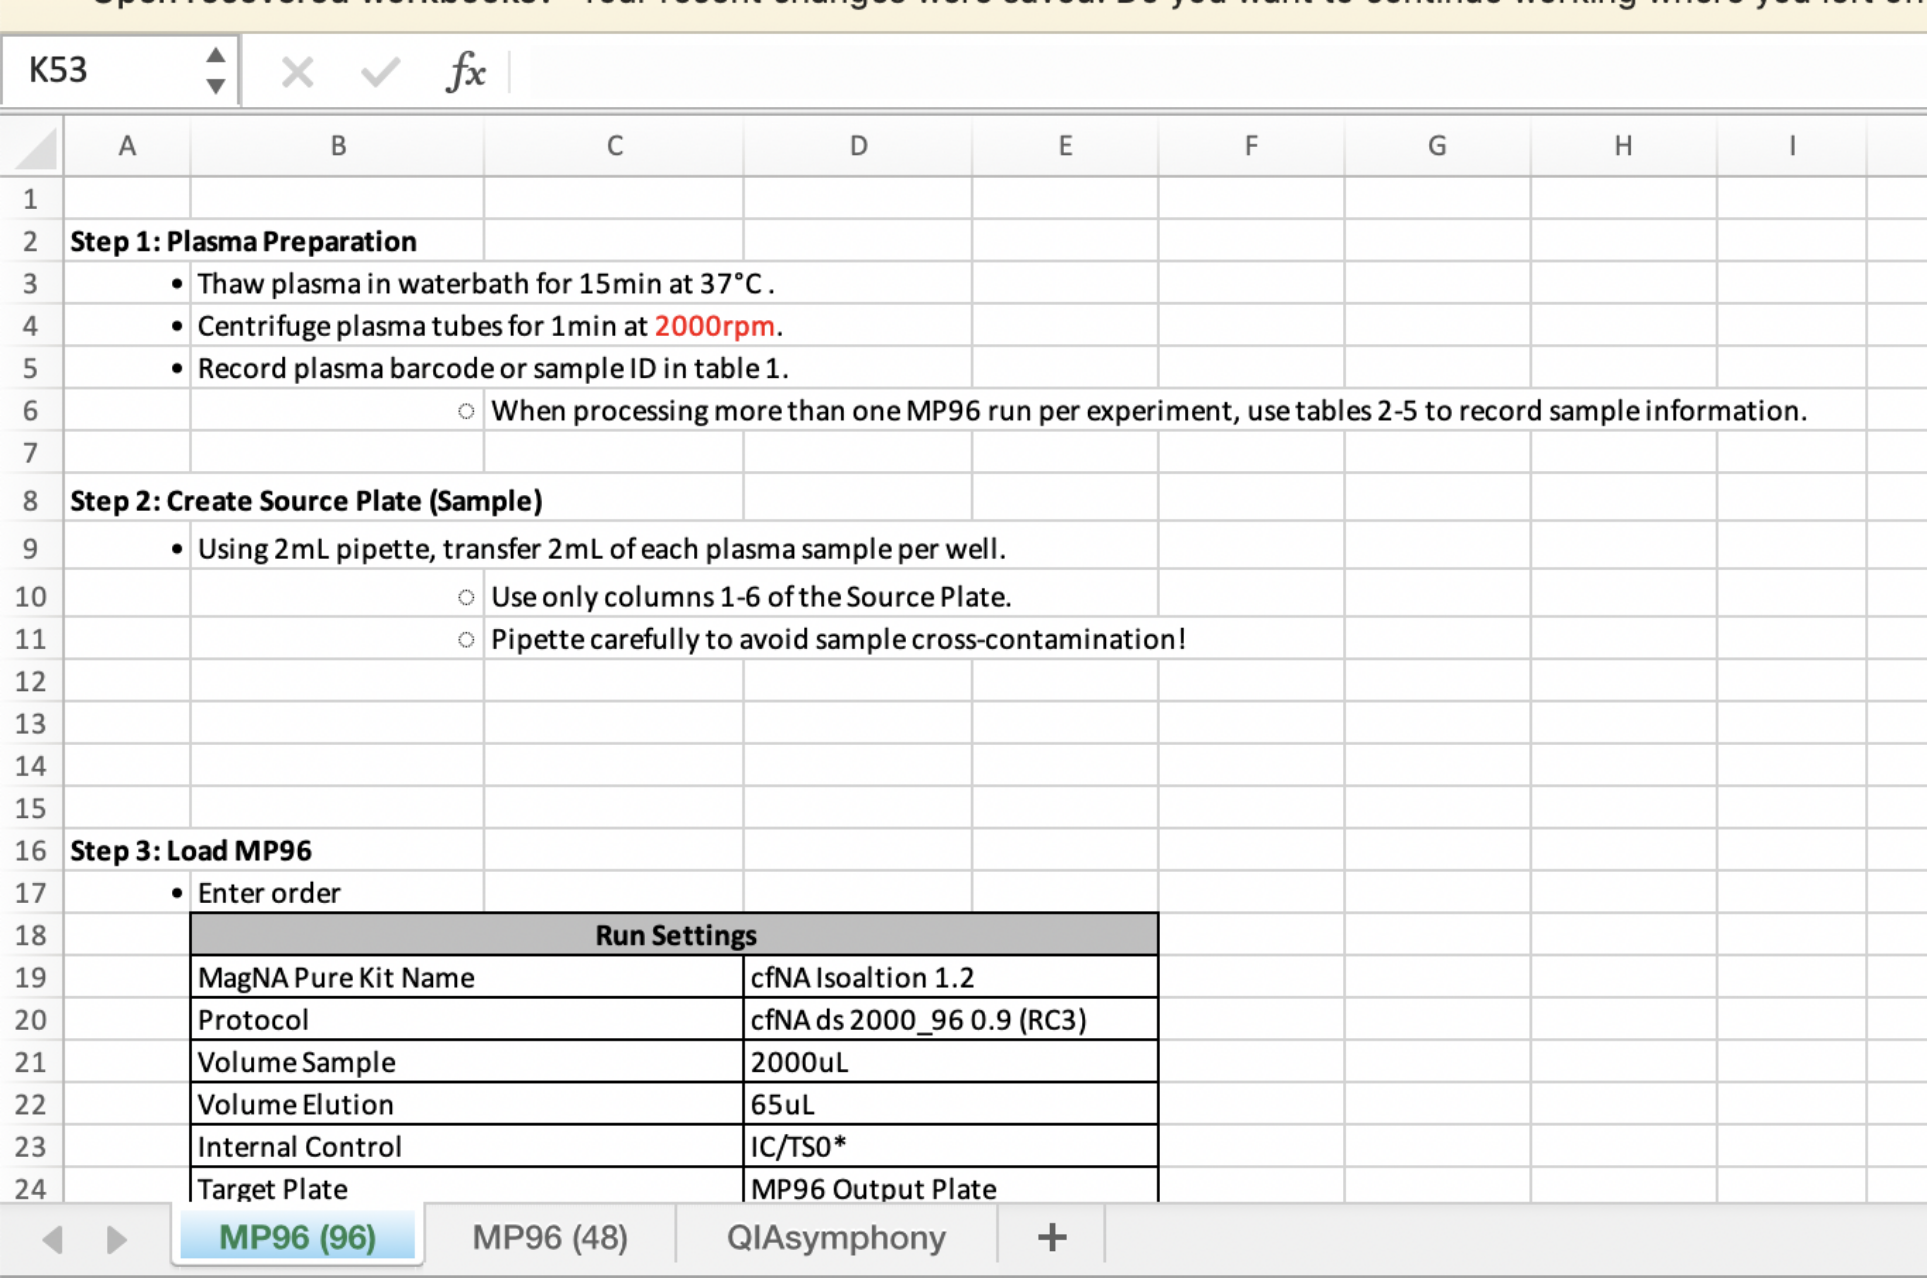
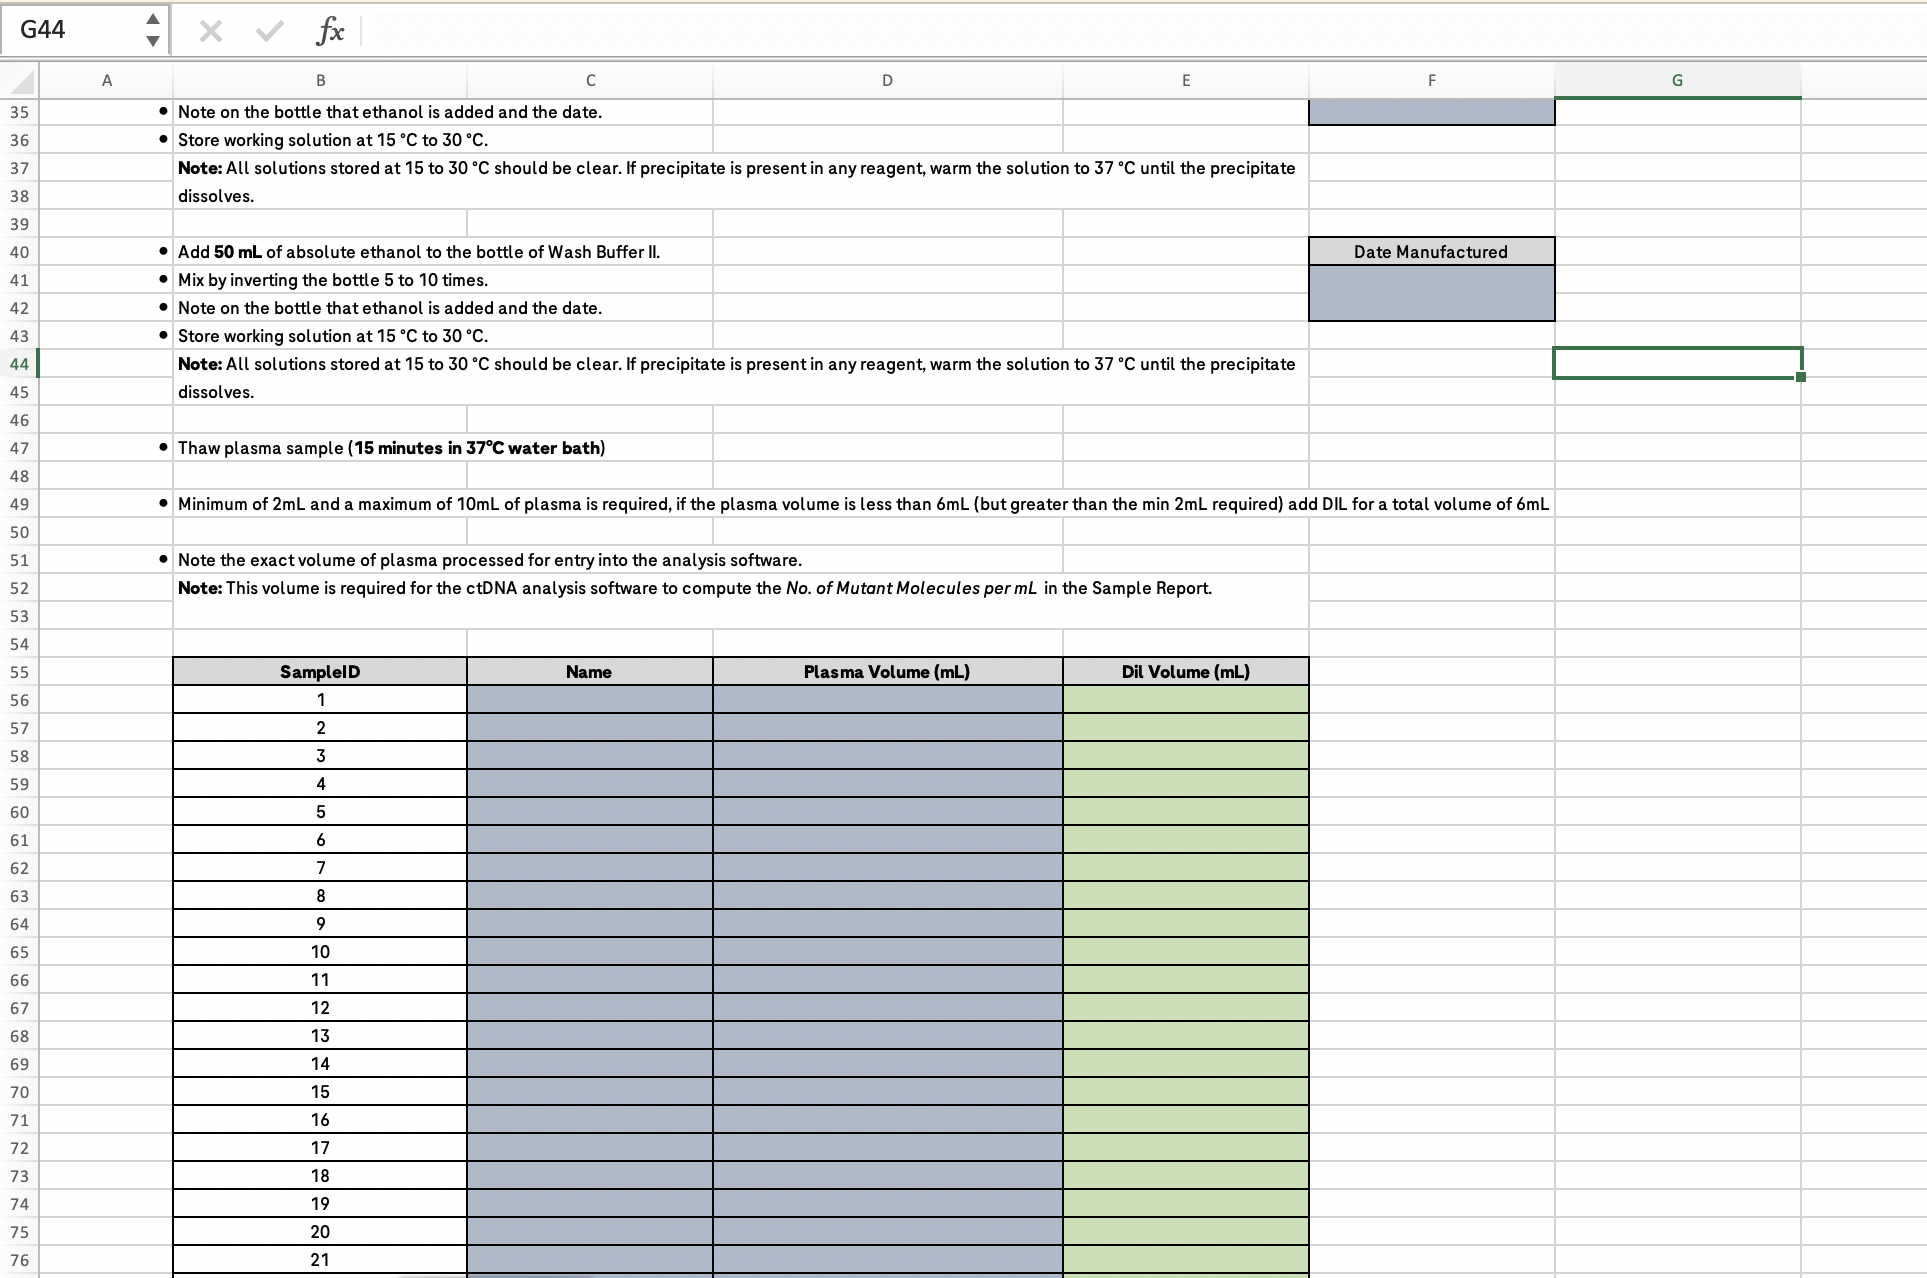
The spreadsheets and physical notes used for tracking batches of patient samples
Simulated lab research
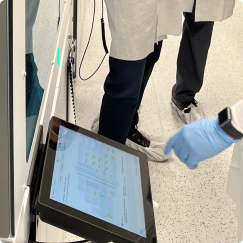
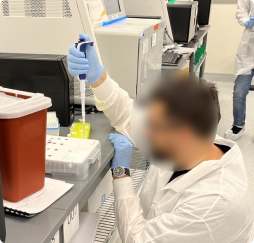
To truly understand the problem, we planned a contextual inquiry in the user's environment. However, getting access to the wet labs (hands-on laboratory environments) involved strict security and sanitation formalities, which delayed our progress.
As a workaround, we created a simulated lab environment with cardboard devices replicating the ones used in the labs. We used actual containers and pool tubes (sample collection tubes) wherever possible to give the users a natural feel of the lab. We added labels to make the props clear.
Key observations from user research that translated into application features
Mapping the workflow
From our research, we mapped the technician's complete sample processing workflow: every instrument they touch, every system they log into, and every handoff point where errors can creep in. This workflow map is agnostic of any specific test type or device, representing the universal flow across the lab.
Ideation
Before jumping into solutions, we mapped every user task by how often it's performed and how critical it is. This helped us focus on the features that deliver the most value and resist scope creep.
Whiteboard sessions
We involved the core team in whiteboarding exercises before committing to building anything. These sessions gave developers, product owners, and designers a shared space to discuss challenges, raise ideas, and align on direction early. The solutions we agreed on were stronger because they came from multiple perspectives.
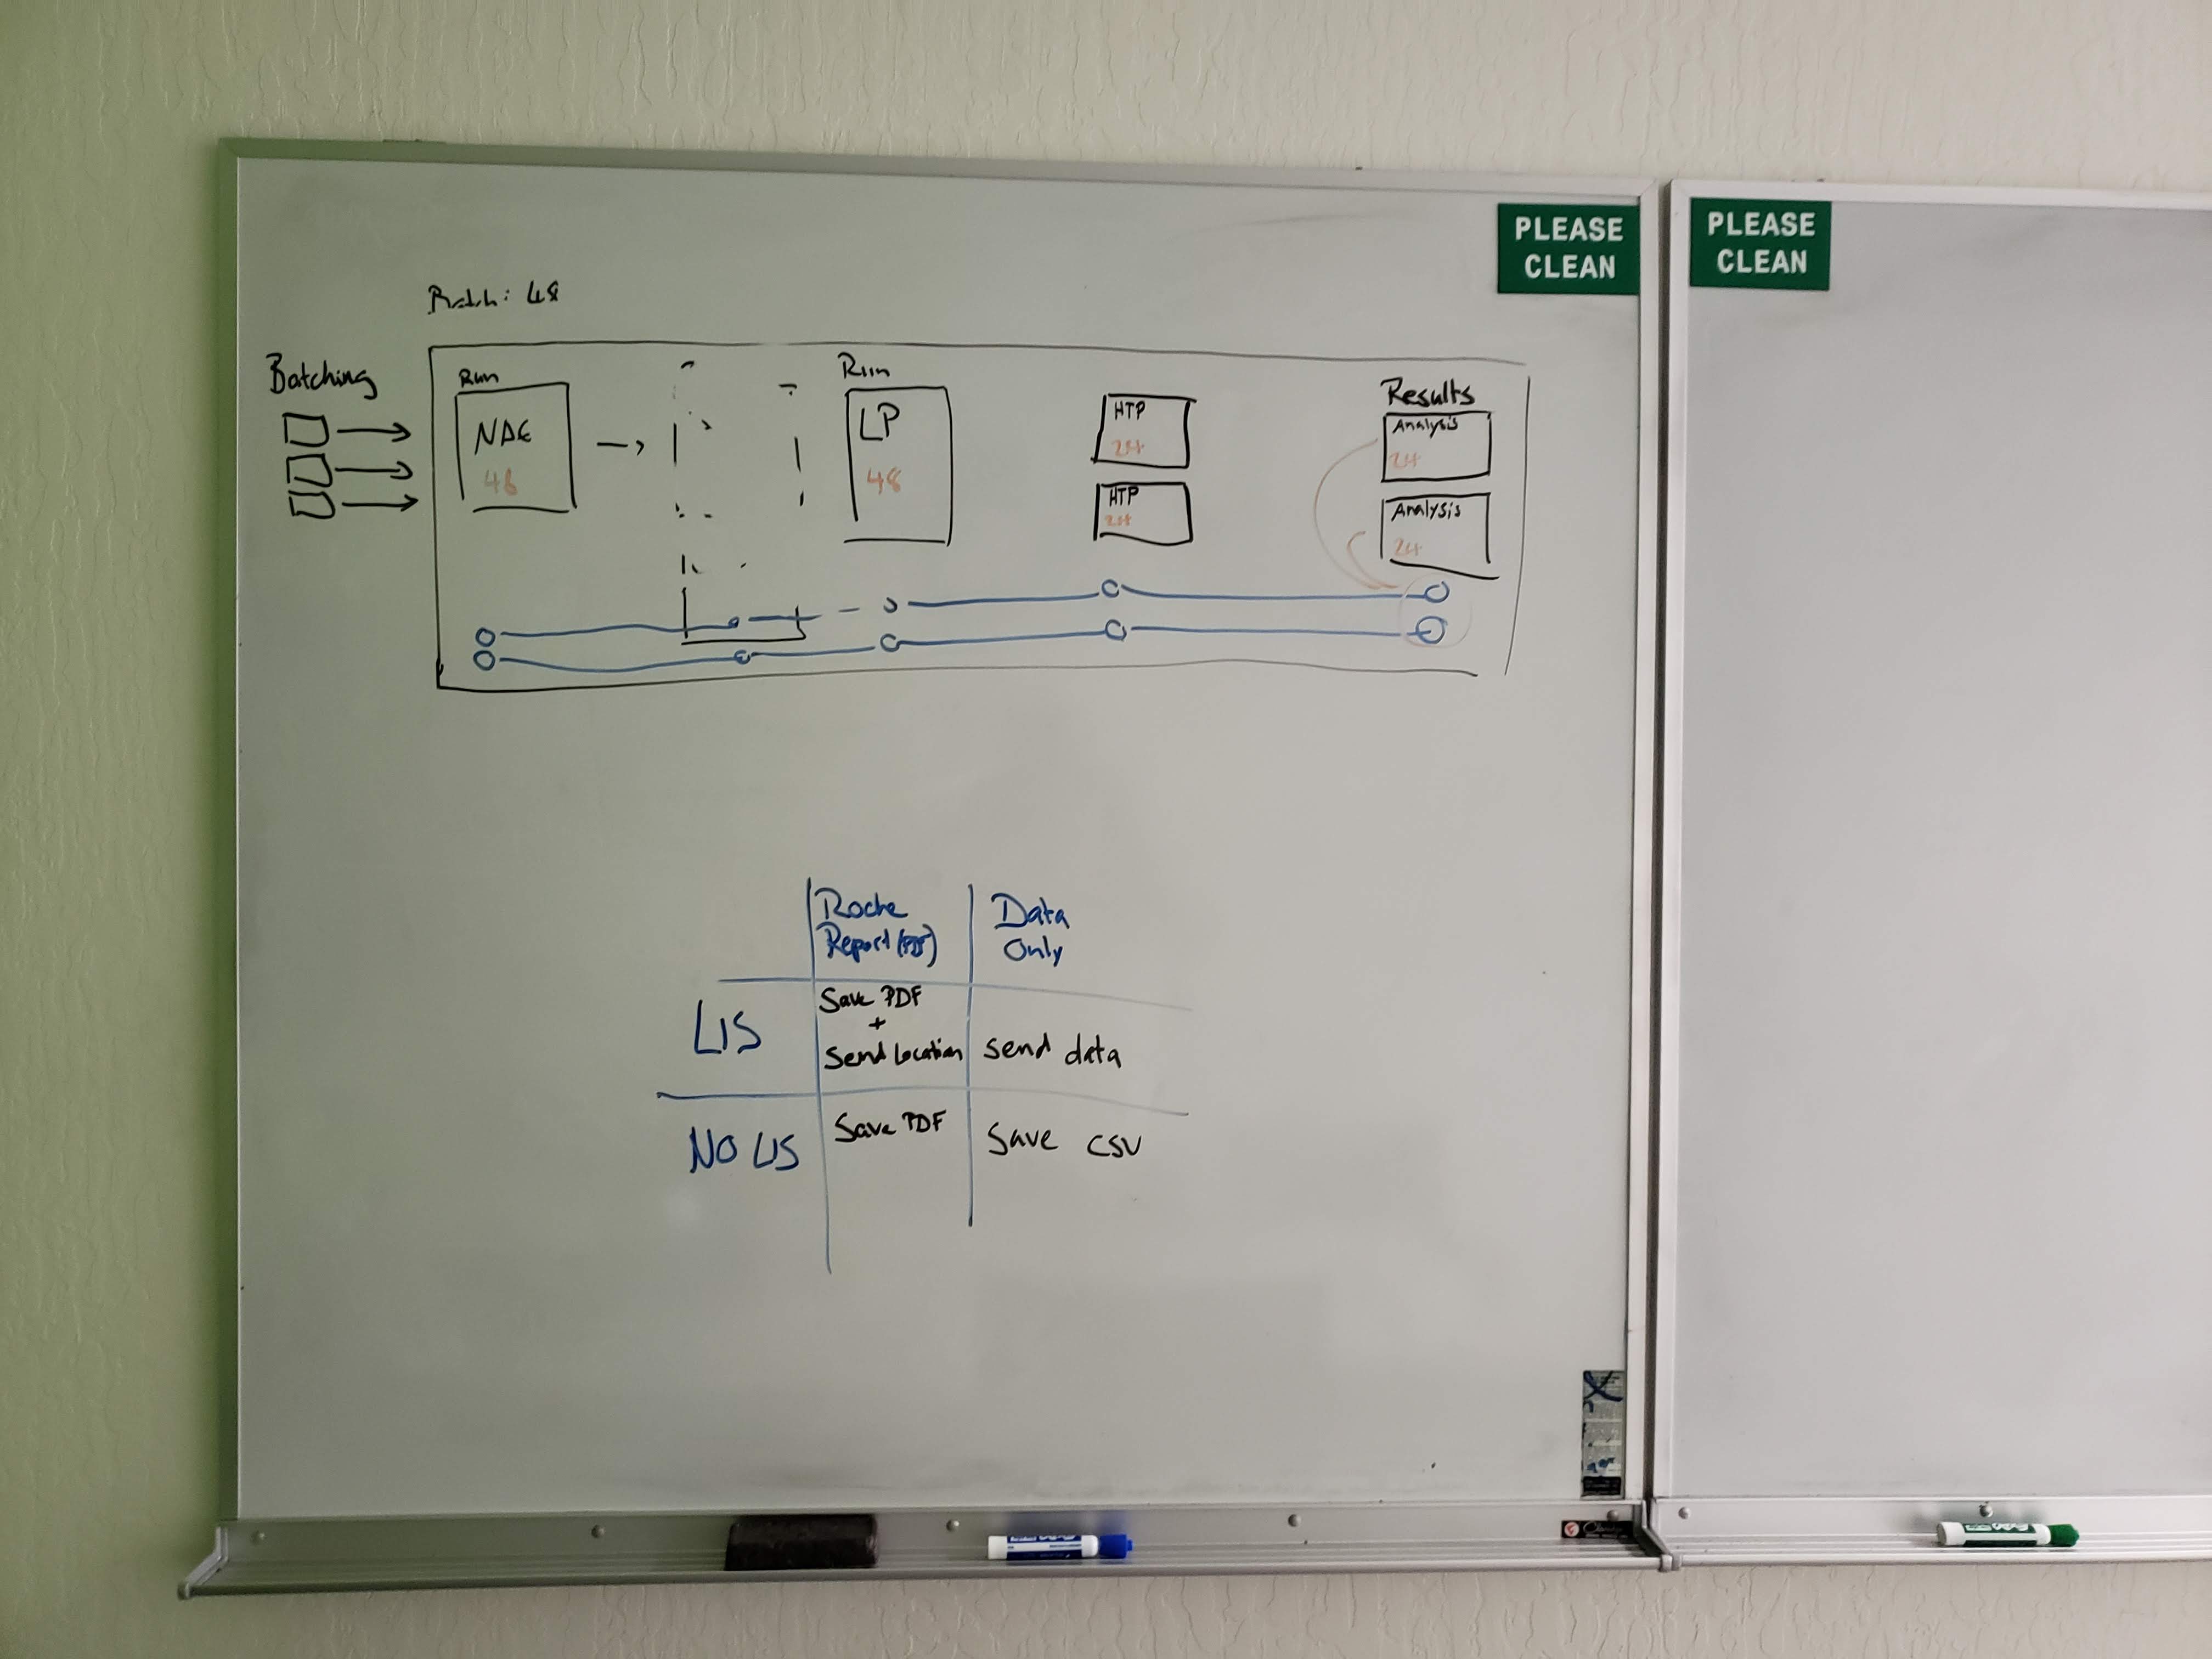
Feature set discussion
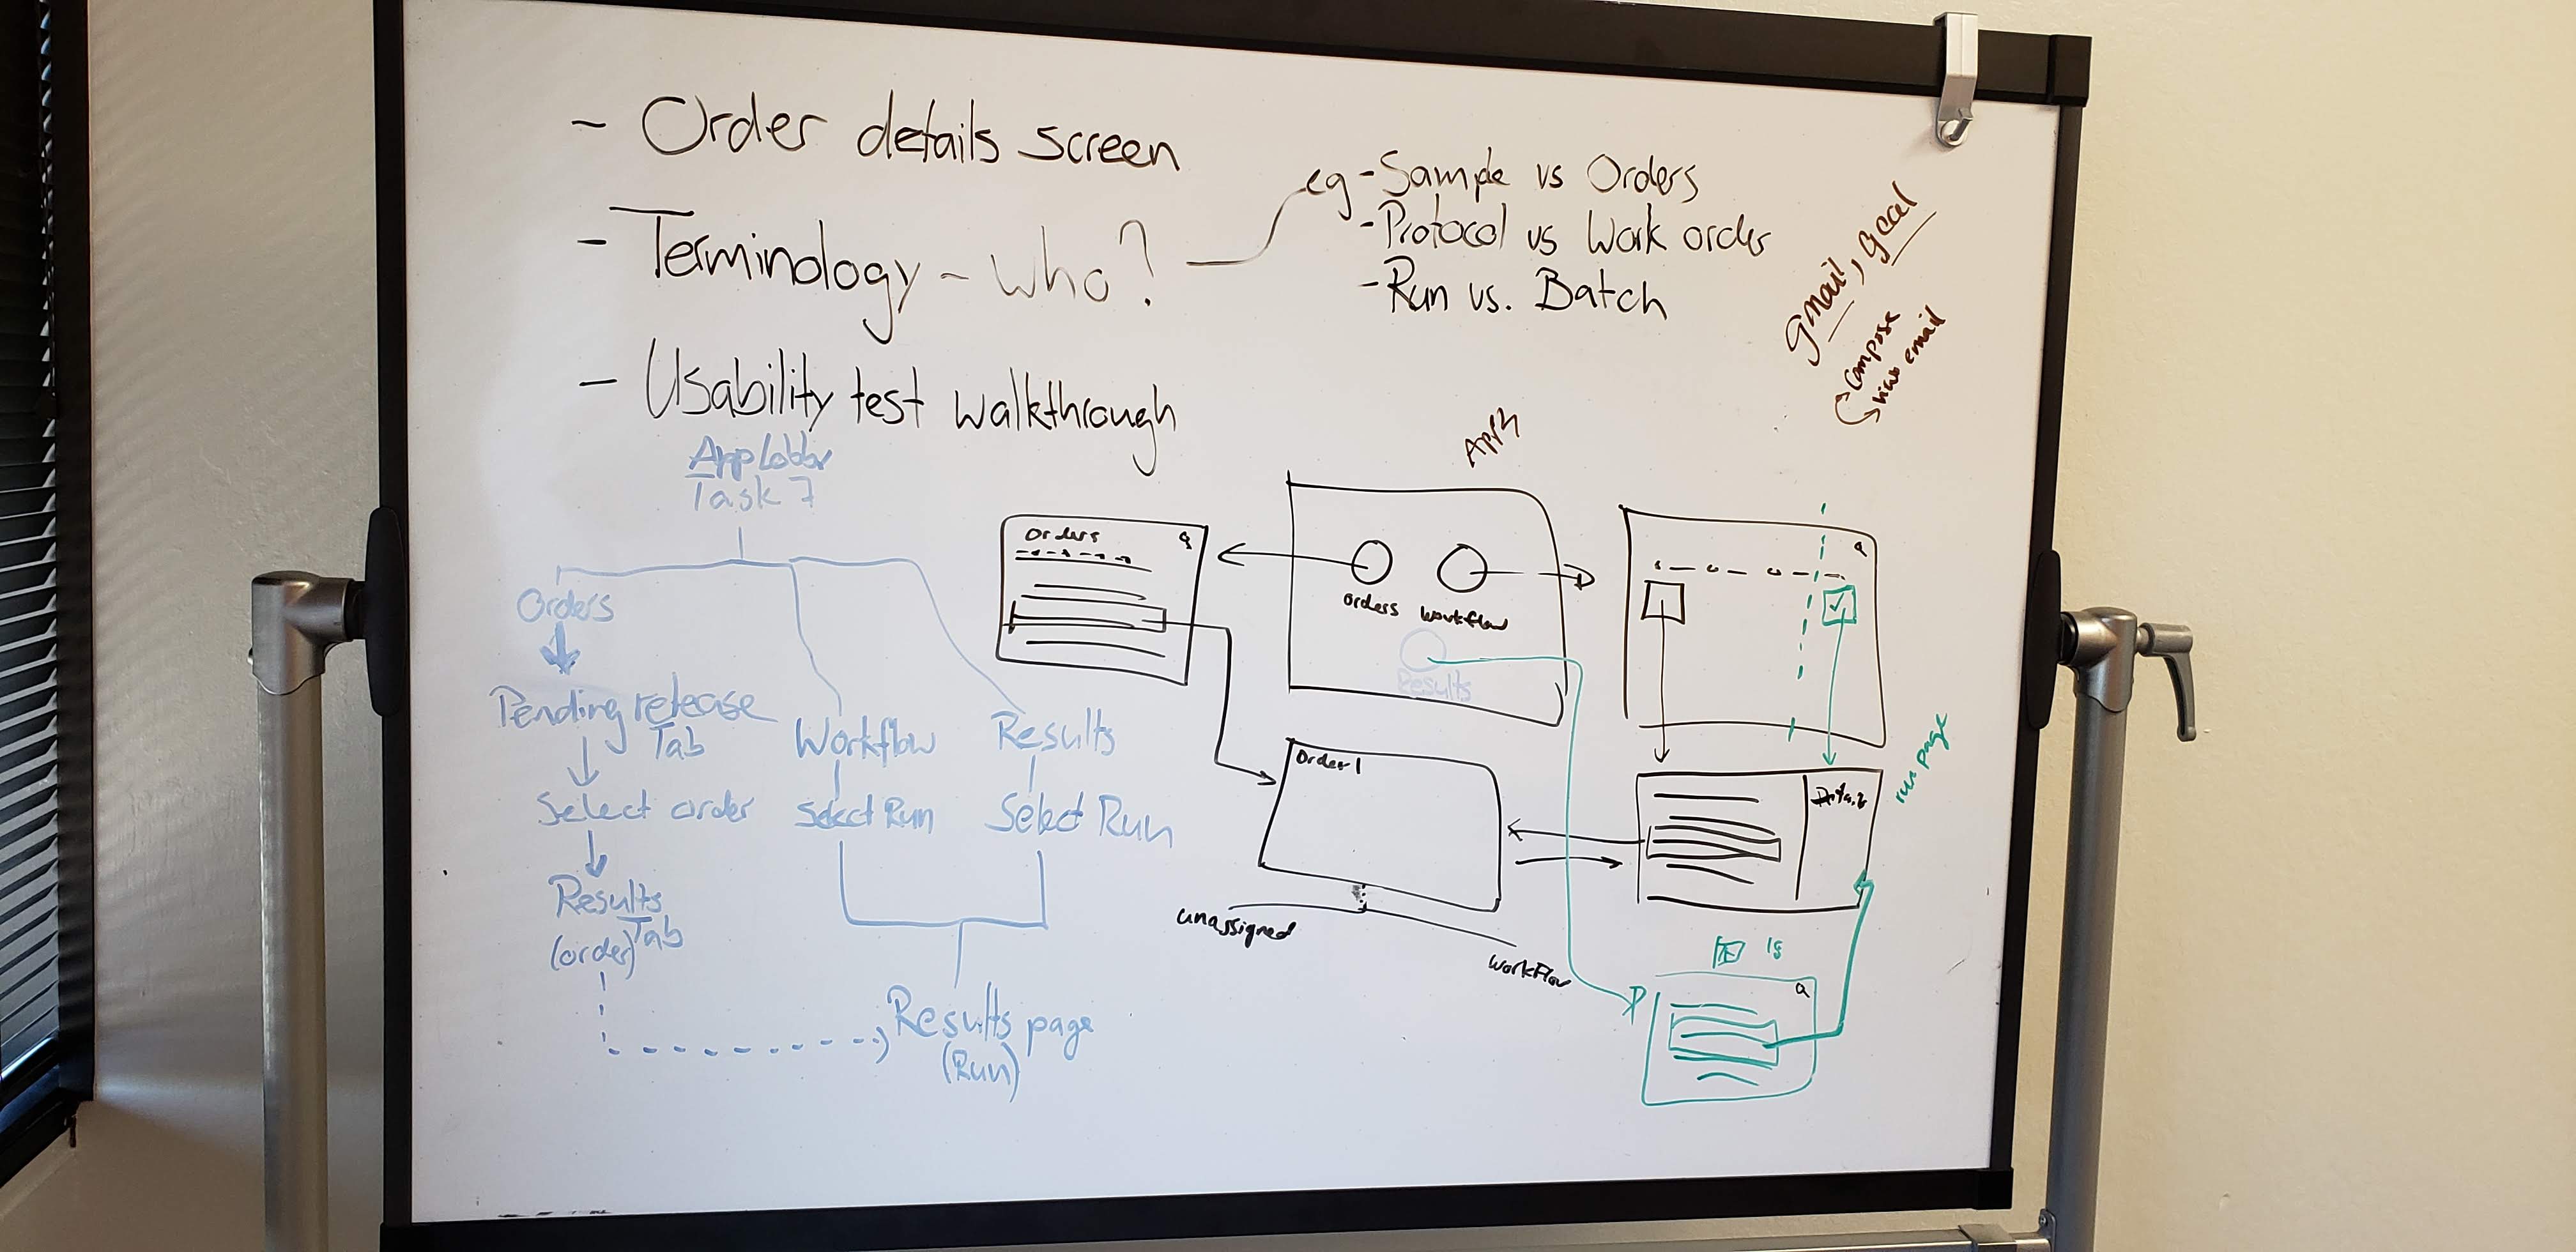
Whiteboard brainstorming session
Concept explorations
We used MIRO boards to map out every possible flow before giving any solution a visual form. Key questions we resolved included: What happens when a sample fails mid-workflow? How does a technician handle partial batches? What if two containers share overlapping sample IDs? Working through these scenarios across teams ensured no edge cases were missed.
Concept creation - Batching samples
Creating a batch of samples is the very first step in the workflow. After exploring different concepts, we narrowed our focus to two potential user flows:
Option A: Samples first. The technician selects individual samples, then groups them into a batch. This mirrors how they already think about the task.
Option B: Batch first. The technician creates an empty batch, then assigns samples to it. This gives more upfront structure but requires planning ahead.
Both options reduce errors and improve traceability. To find out which one felt more natural, we needed to test them with actual users.
Evaluating concepts with users
We interviewed four users and walked them through both solutions, asked them to weigh the pros and cons of each, and explain their decision-making process. The majority of users preferred the option where they would select the samples and define a batch out of it - this option was much closer to their existing mental model.
Designing key screens
With concepts validated and an established design system in place, we moved directly into visual design. This allowed us to focus on getting the interactions and flows right rather than rebuilding UI foundations. Here are the key screens shaped directly by our research findings.
Registering patient samples
Our research showed that technicians handle two distinct scenarios: registering one or two samples on the spot, and bulk-registering a full batch received from a collection center. The application supports both flows based on this finding.
Manual entry
A provision to manually enter sample details as a form. This is helpful for users to register samples in an impromptu way.
Bulk upload
A way to register a large number of samples in one go. The application supports a CSV file upload where the users can download a template, add data, and upload to register multiple samples at once.
Scanning barcodes
During user research, we observed that lab users strongly preferred scanning sample barcodes over typing IDs manually. This observation directly shaped a core design decision: providing barcode scanning at every step where a sample needs to be identified.
The test quality is evaluated by a control sample (a known reference sample used to verify test accuracy). Control samples are introduced during the workflow and the application allows the user to scan the control sample barcode.
Sample history and workflow tracking
From our research, we identified three critical statuses that technicians need at a glance: the past workflow steps that were already processed, the current status of the sample, and the downstream steps still pending. This three-part view replaced the mental tracking users were doing across spreadsheets and physical notes.
From design to product
After iterative design refinements and stakeholder alignment, the designs were handed off to development using detailed Figma specifications. The product was released as a cloud-based SaaS platform, now used by diagnostic labs for end-to-end sample tracking and workflow management.
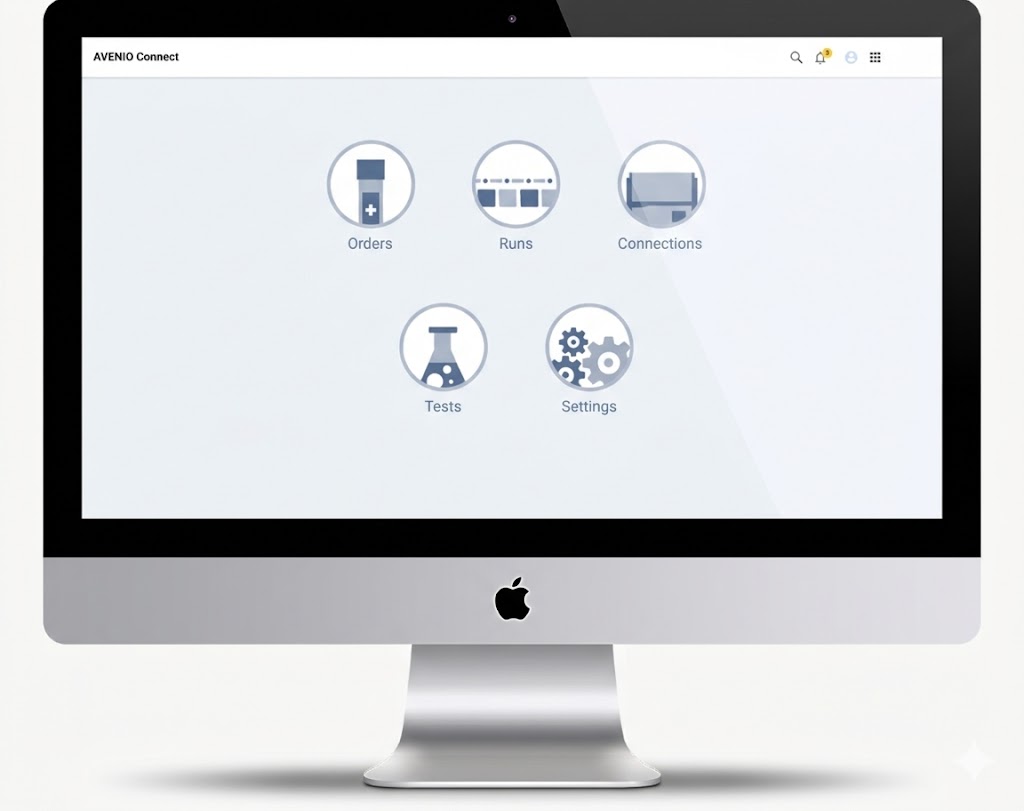
The technician's home base with clear access to Orders, Runs, Connections, Tests, and Settings
All active runs organized by workflow stage with color-coded status cards
Individual sample statuses, run metadata, and downloadable reports
Formative usability
A formative usability evaluation session was conducted with internal lab users. The target lab users were Lab directors, Lab operators, and a Lab manager. The test script was prepared with 8 tasks that need to be performed on a clickable prototype that I created. The users were given the context, and each task was explained.
Lab testing
User feedback
Prototype walkthrough
Results & Impact
Sample registration time
The bulk upload feature transformed how technicians register patient samples. What previously required manual entry of each sample one by one was reduced to a single CSV upload.
Sample status lookup
Locating a sample's current status was one of the most frequent tasks in the lab. With the old process, technicians had to dig through spreadsheets, read text entries for pass/fail, and cross-check physical notes. In AVENIO Connect, they search or scan the sample ID and see the status instantly through color-coded icons.
Other notable improvements
Based on a 4-week evaluation with 8 lab professionals (average 10 years of laboratory experience):
- Easy learning curve. Users performed tasks independently after just a few sessions, with no formal training required.
- Intuitive core workflows. Sample preparation, pooling (combining samples for batch processing), and sequencing steps were consistently rated as smooth by all participants.
- High first-attempt success. Pooling was completed confidently on the first try, with participants describing it as the easiest workflow.
Reflection & Learnings
The simulated lab turned out to be an unexpected advantage. What started as a workaround for access restrictions gave us something a real lab couldn't: relaxed users. In a real environment, technicians are constantly aware of contamination risks, which makes them guarded and less willing to experiment. In our cardboard lab, they were flexible, open to trying things differently, and more vocal about what frustrated them. The quality of feedback was richer because of it.
User research became the tiebreaker in stakeholder disagreements. There were moments when designers, developers, and product owners had conflicting views on direction. Presenting data from user research consistently helped align the team. When people saw what users actually said and did, the disagreements stopped. It reinforced that research isn't just a design phase; it's a communication tool that keeps the whole team anchored to the same reality.