Bulk Sample Transfer
Visually guided sample transfer tool for lab technicians performing pipetting operations
Challenge
During the sample workflow in AVENIO Connect, batches of patient samples must be physically pipetted (transferred using a precision instrument) from one container to another. Lab technicians tracked source and target positions using spreadsheets and handwritten notes, creating a high risk of placing samples in the wrong wells.
Solution
We designed a visual guidance feature within AVENIO Connect that walks the technician through each transfer step on screen. It replaced spreadsheet tracking entirely, recommending target positions based on the pipetting method and showing real-time progress.
Where this fits
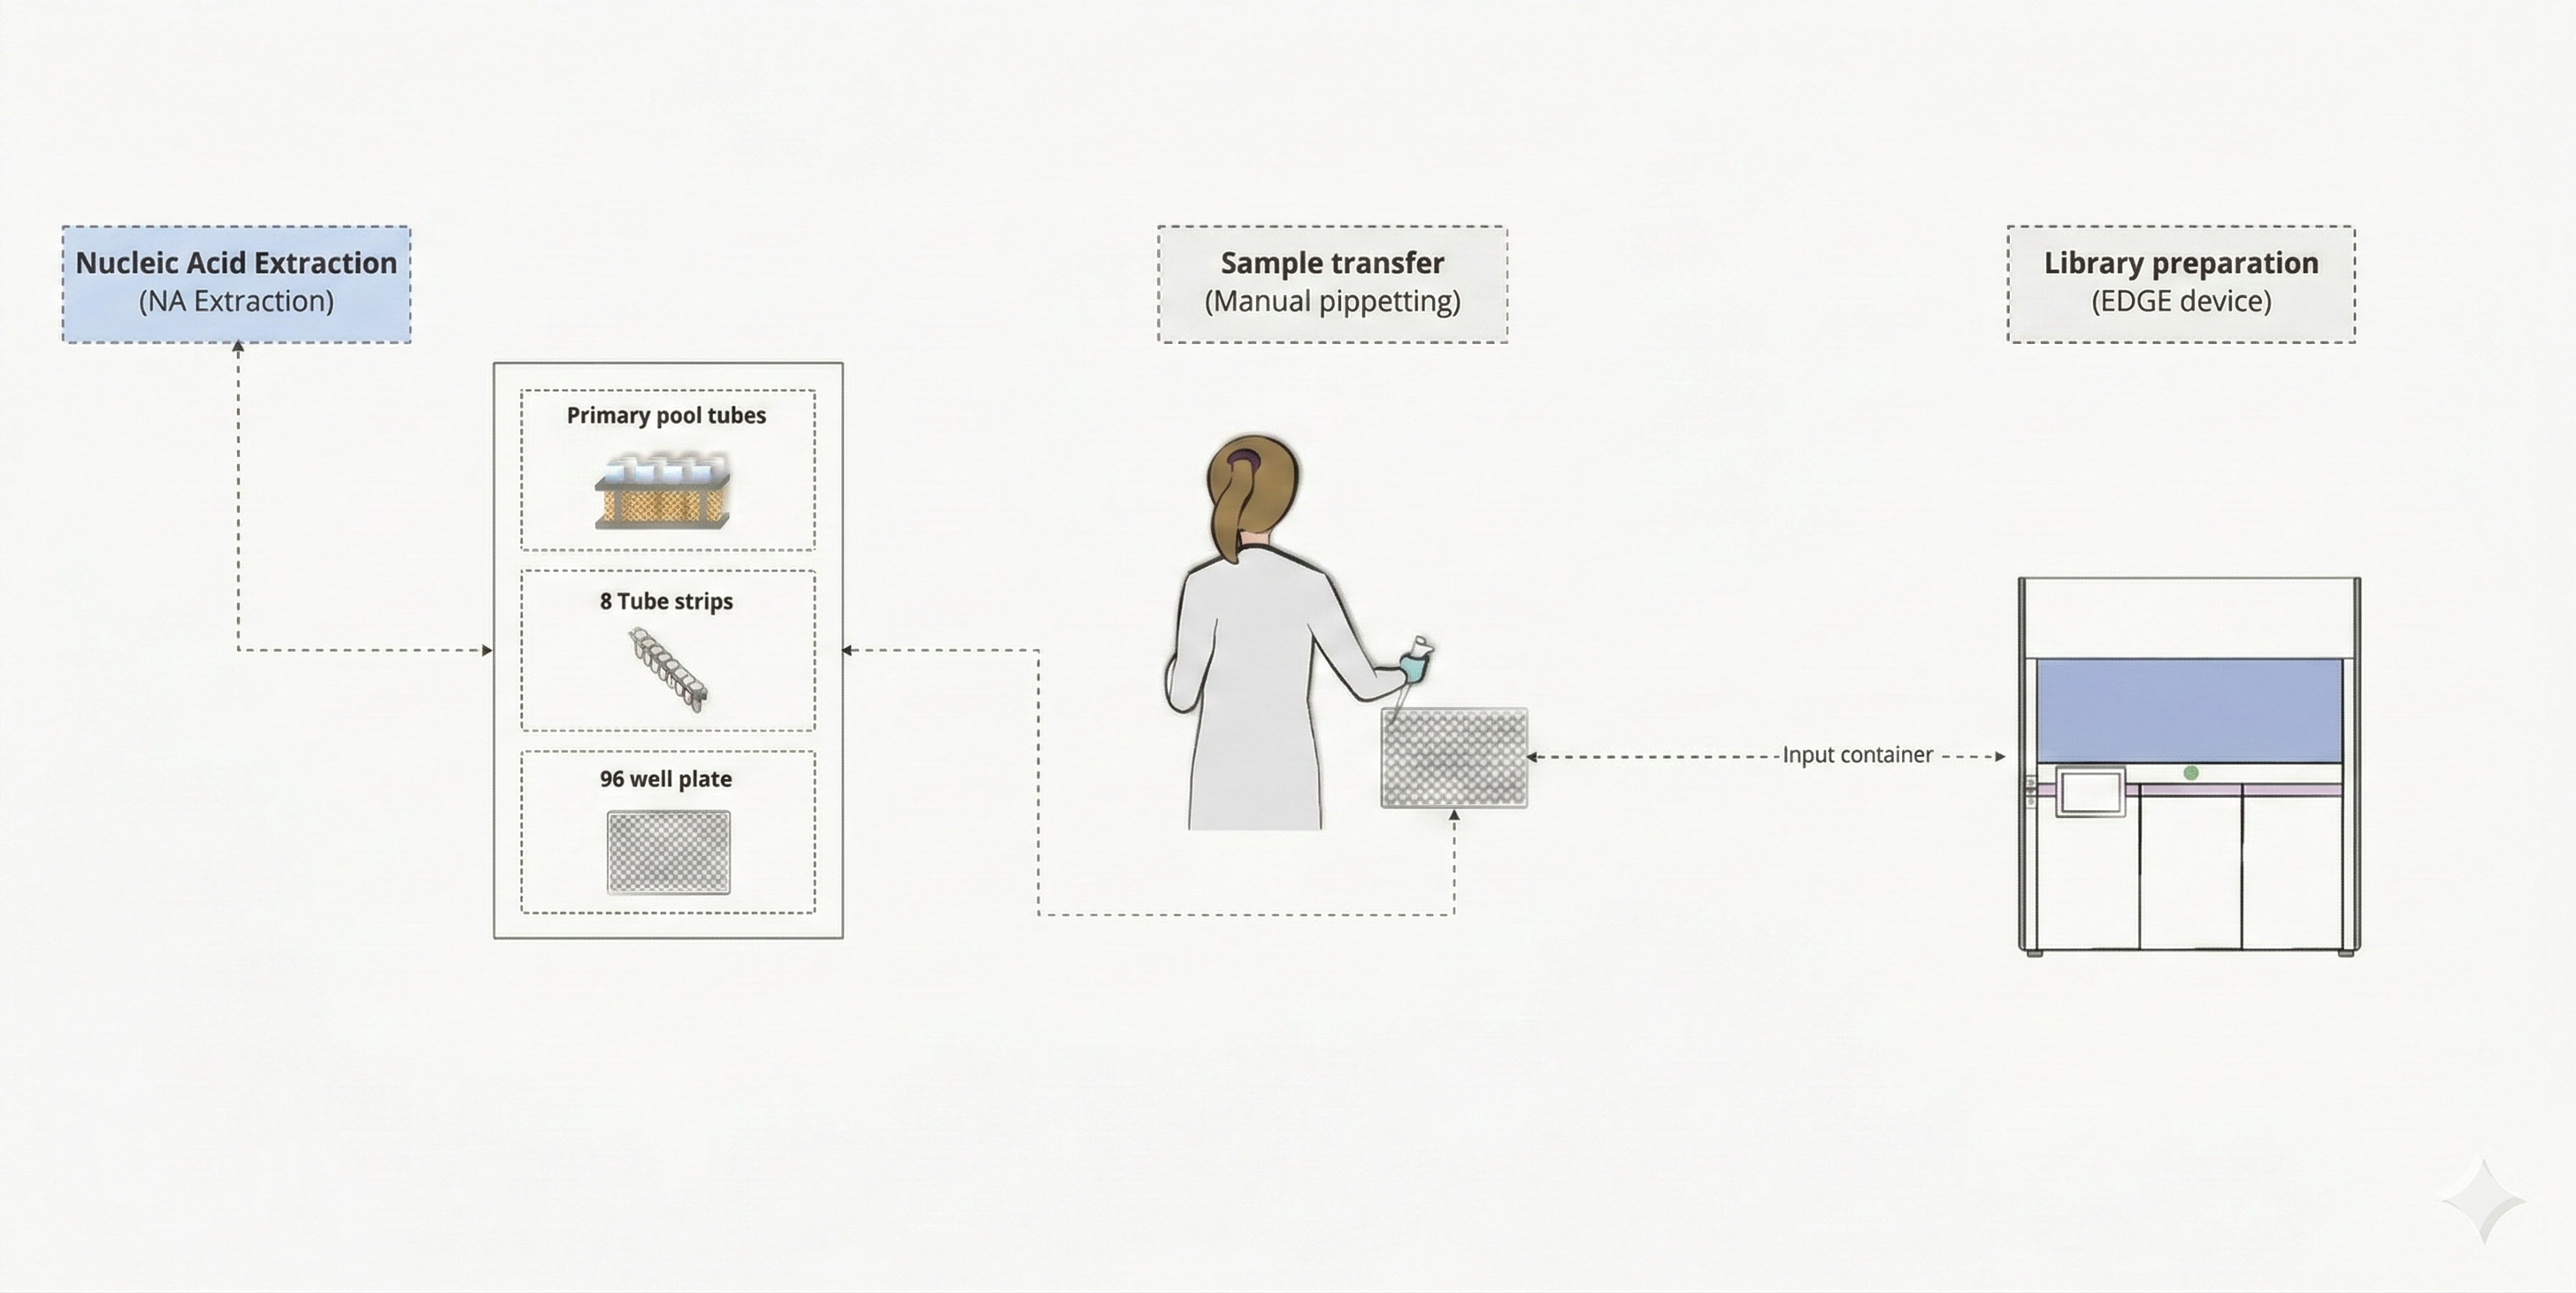
Bulk sample transfer is a critical manual step within the AVENIO Connect workflow. After samples complete a processing stage, they need to be physically moved from output containers to input containers for the next stage. This is where errors are most likely to happen: technicians organize source containers in a rack, then use a pipette to transfer each sample to a specific position in the target container, tracking everything by hand.
Research & Discovery
We identified lab operators who perform sample transfers daily and observed their end-to-end workflow. This helped us understand their lab environment, the physical setup they use, the tools they rely on, and the specific challenges they face when moving samples between containers.
Our user
The primary user is a lab operator responsible for the physical handling of patient samples. They perform multiple transfer batches per shift, often switching between different container types and pipetting methods depending on the test protocol.
What we learned
Decoding user interviews, two critical insights emerged that shaped every design decision that followed.
The user's mental model
Lab technicians always organize their physical workspace with source containers on the left and target containers on the right, transferring samples left to right. Any digital solution that breaks this spatial model would fight their muscle memory and increase errors.
User needs and challenges
The interviews revealed that the biggest pain point wasn't the pipetting itself. It was the cognitive overhead of tracking which sample goes where. Users relied on handwritten notes, printed spreadsheets, and physical markers to keep track, creating multiple points of failure.
I keep a printed sheet next to me and cross off each sample after I pipette it. If I get interrupted, I sometimes lose track and have to start verifying from the beginning.
Before vs. After
- ✗ Handwritten notes & printed spreadsheets
- ✗ No real-time tracking of transfer progress
- ✗ High risk of pipetting into wrong wells
- ✗ Interrupted workflows require re-verification
- ✓ On-screen visual guidance for each step
- ✓ Real-time position tracking & status
- ✓ System-recommended target positions
- ✓ Supports multiple pipetting methods
Concept explorations
We explored two competing interaction models for the transfer flow:
Flow 1: Single screen. All actions happen on one screen. The user sees source and target containers side by side, selects samples, and assigns target positions without navigating away. This keeps the full context visible at all times.
Flow 2: Split activities. The flow is broken into two steps: first select samples from source containers, then assign them to target positions on a separate screen. This simplifies each step but requires the user to hold information between screens.
We chose Flow 1. The single-screen approach matched how technicians work physically: they see both containers in front of them simultaneously. Splitting it across screens would break that spatial awareness.
Design explorations
The first step was to get the base layout right. From user research, we knew that technicians set up their physical workspace with source containers on the left and target containers on the right. The transfer always happens left to right. We wanted to replicate that same spatial experience in the application.
Basic layout
Establishing the core left-to-right mental model. Source containers on the left, target on the right.
Adding structure
Introducing sample data, container previews, and a dedicated visualizer panel.
Detailed wireframe
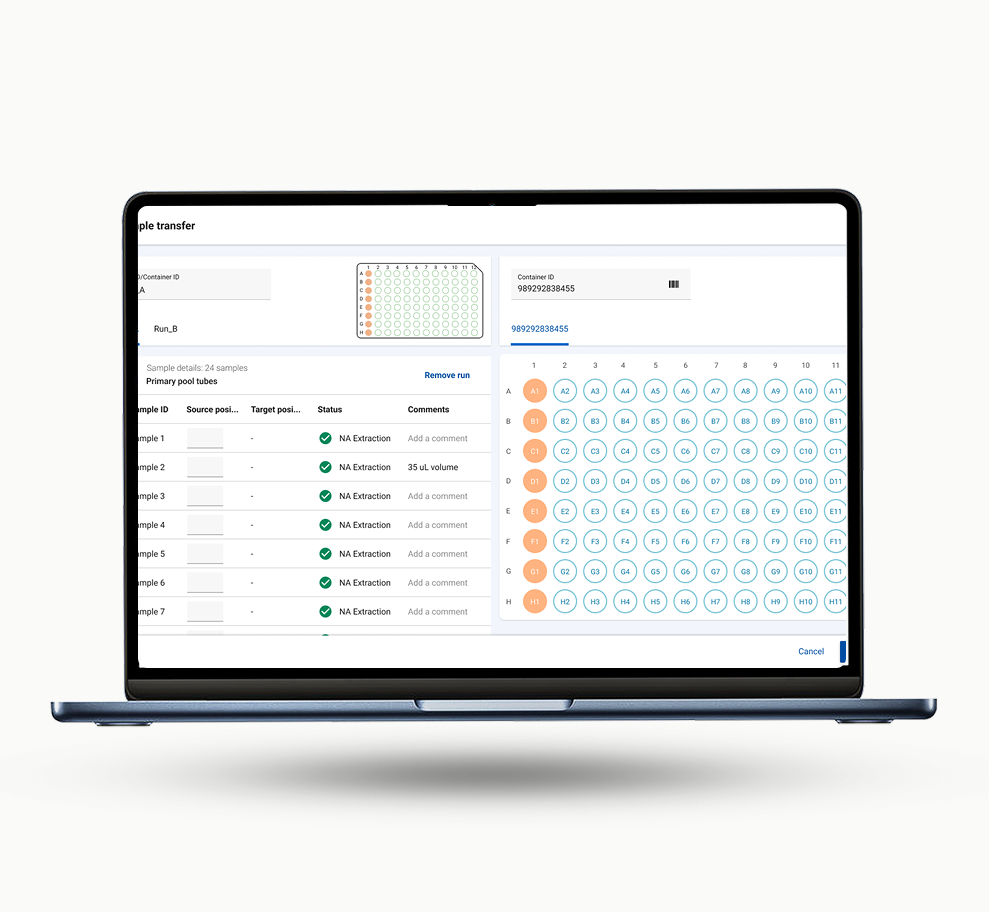
Full-fidelity layout with sample list, 96-well plate grid, and transfer confirmation flow.
Design details
Getting the details right was critical for a tool that lab technicians would use daily under time pressure. Three key areas required deep design attention.
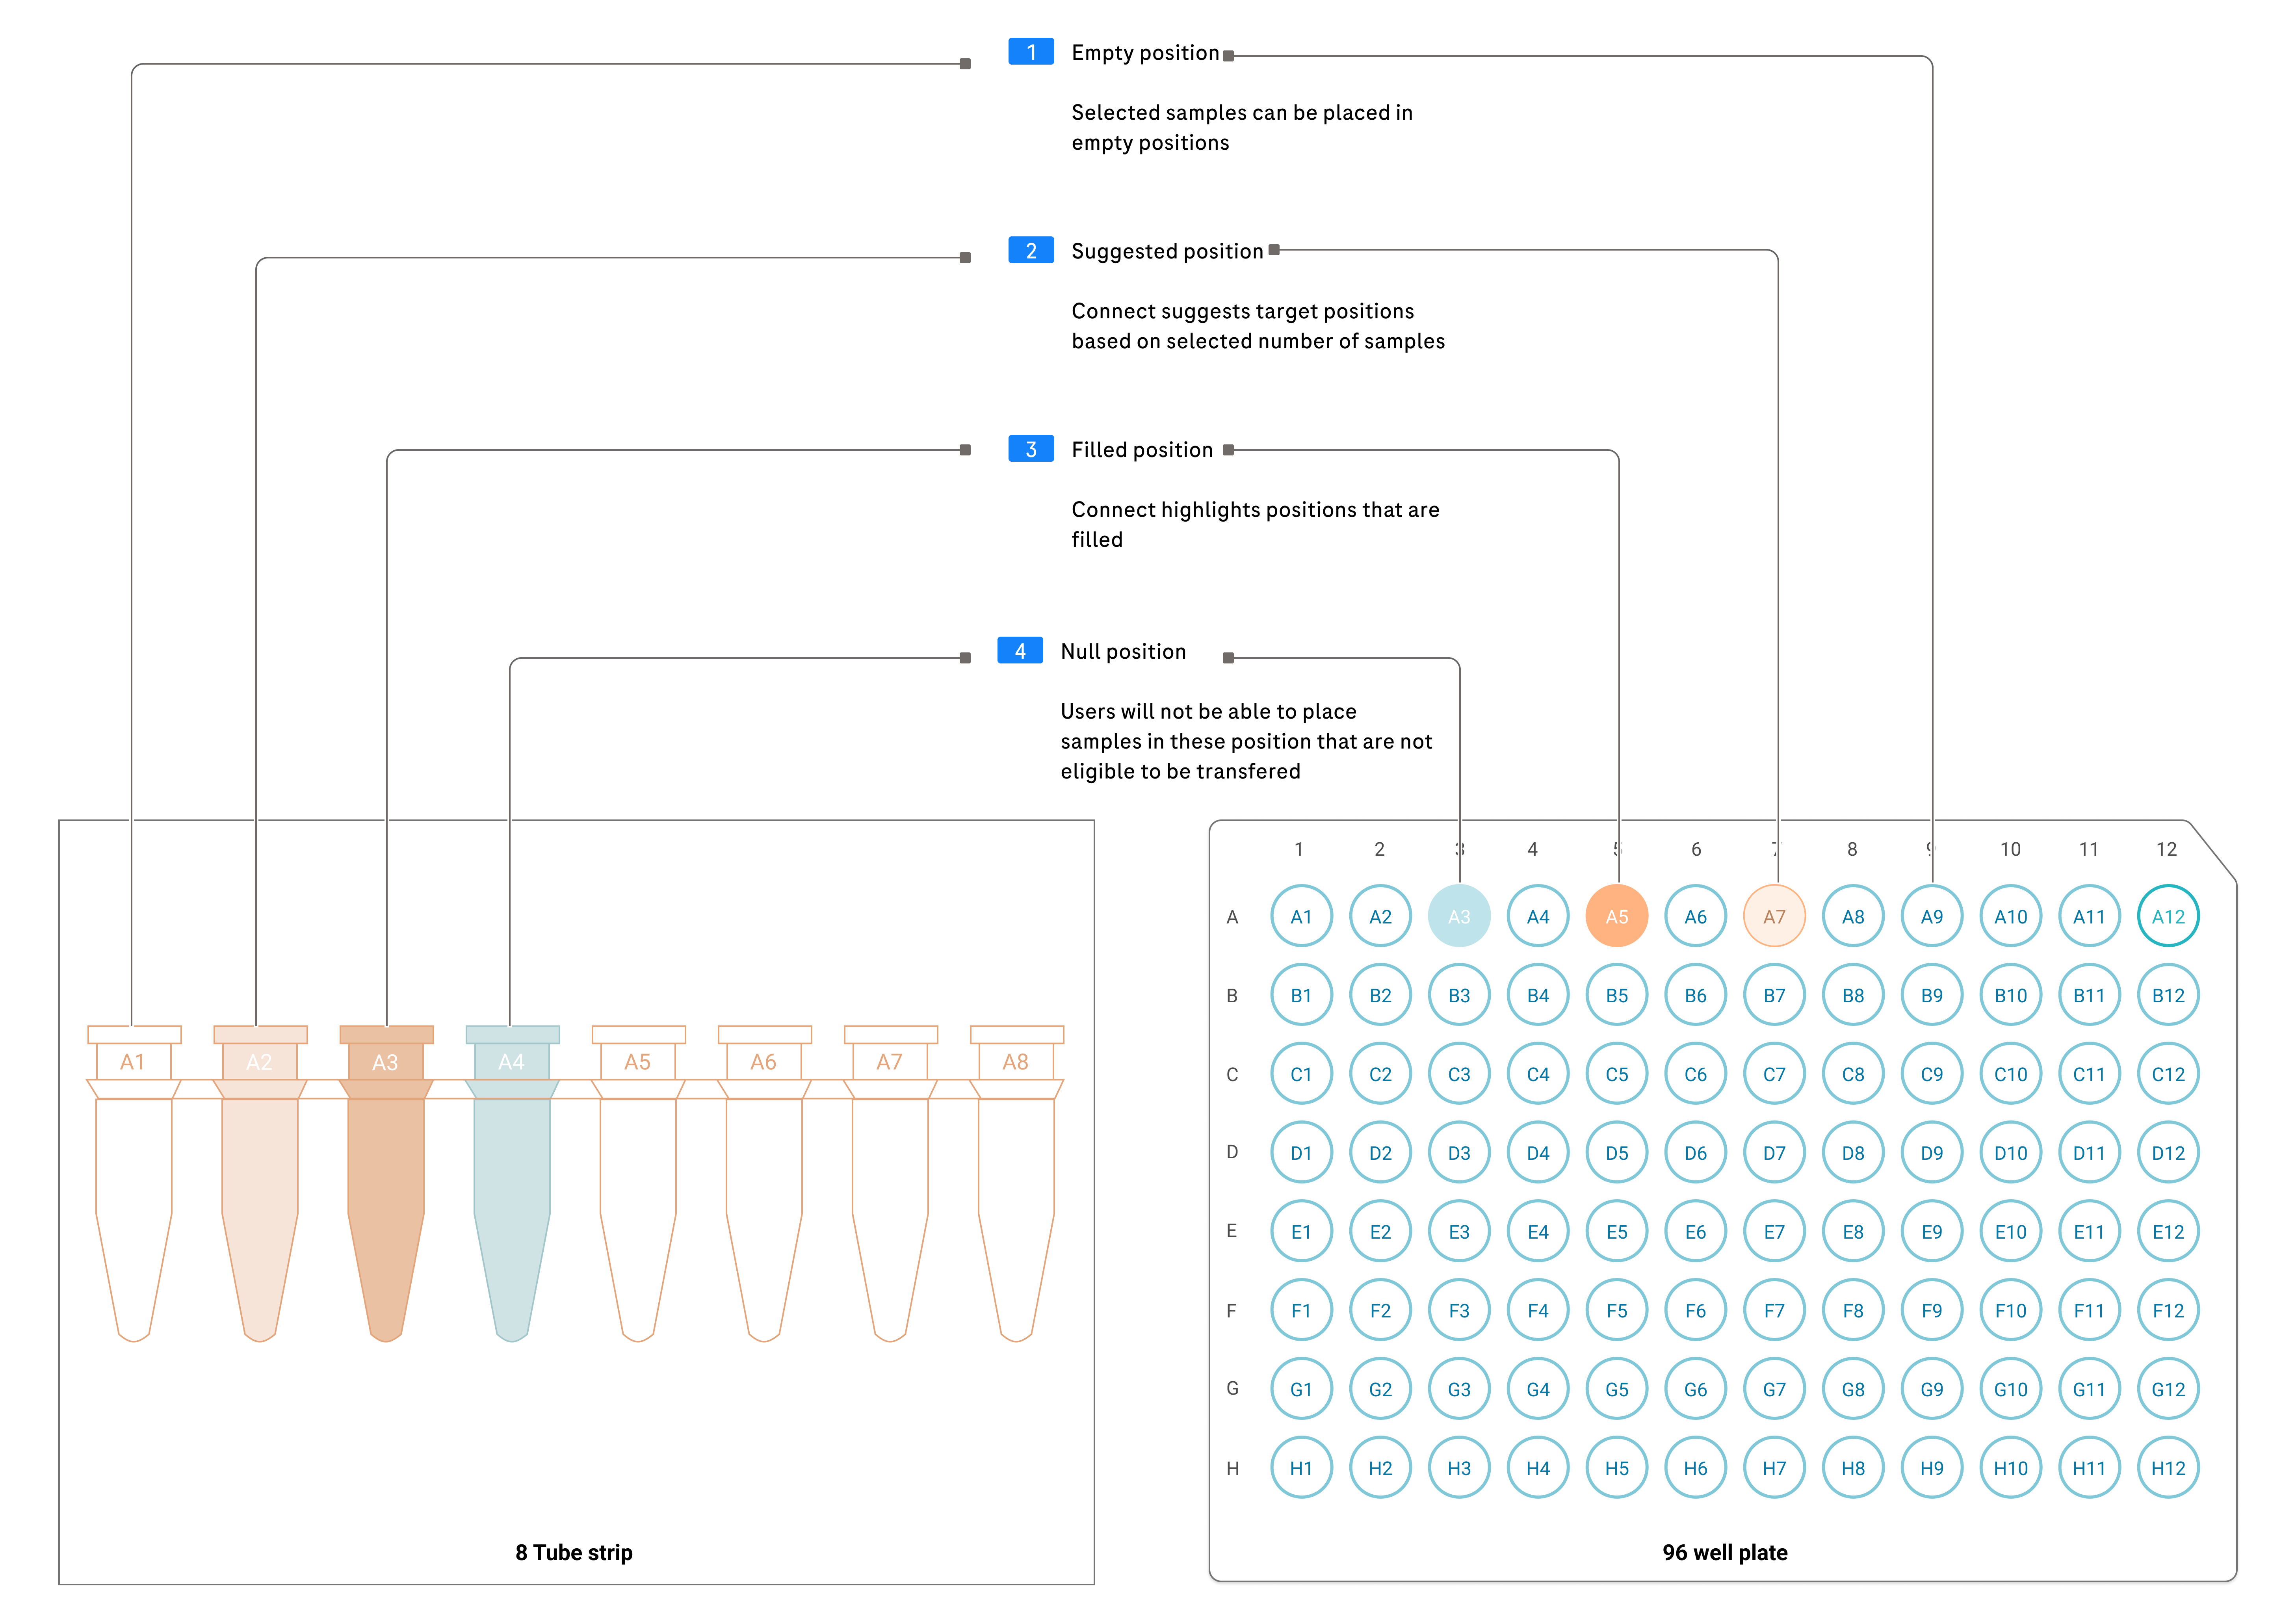
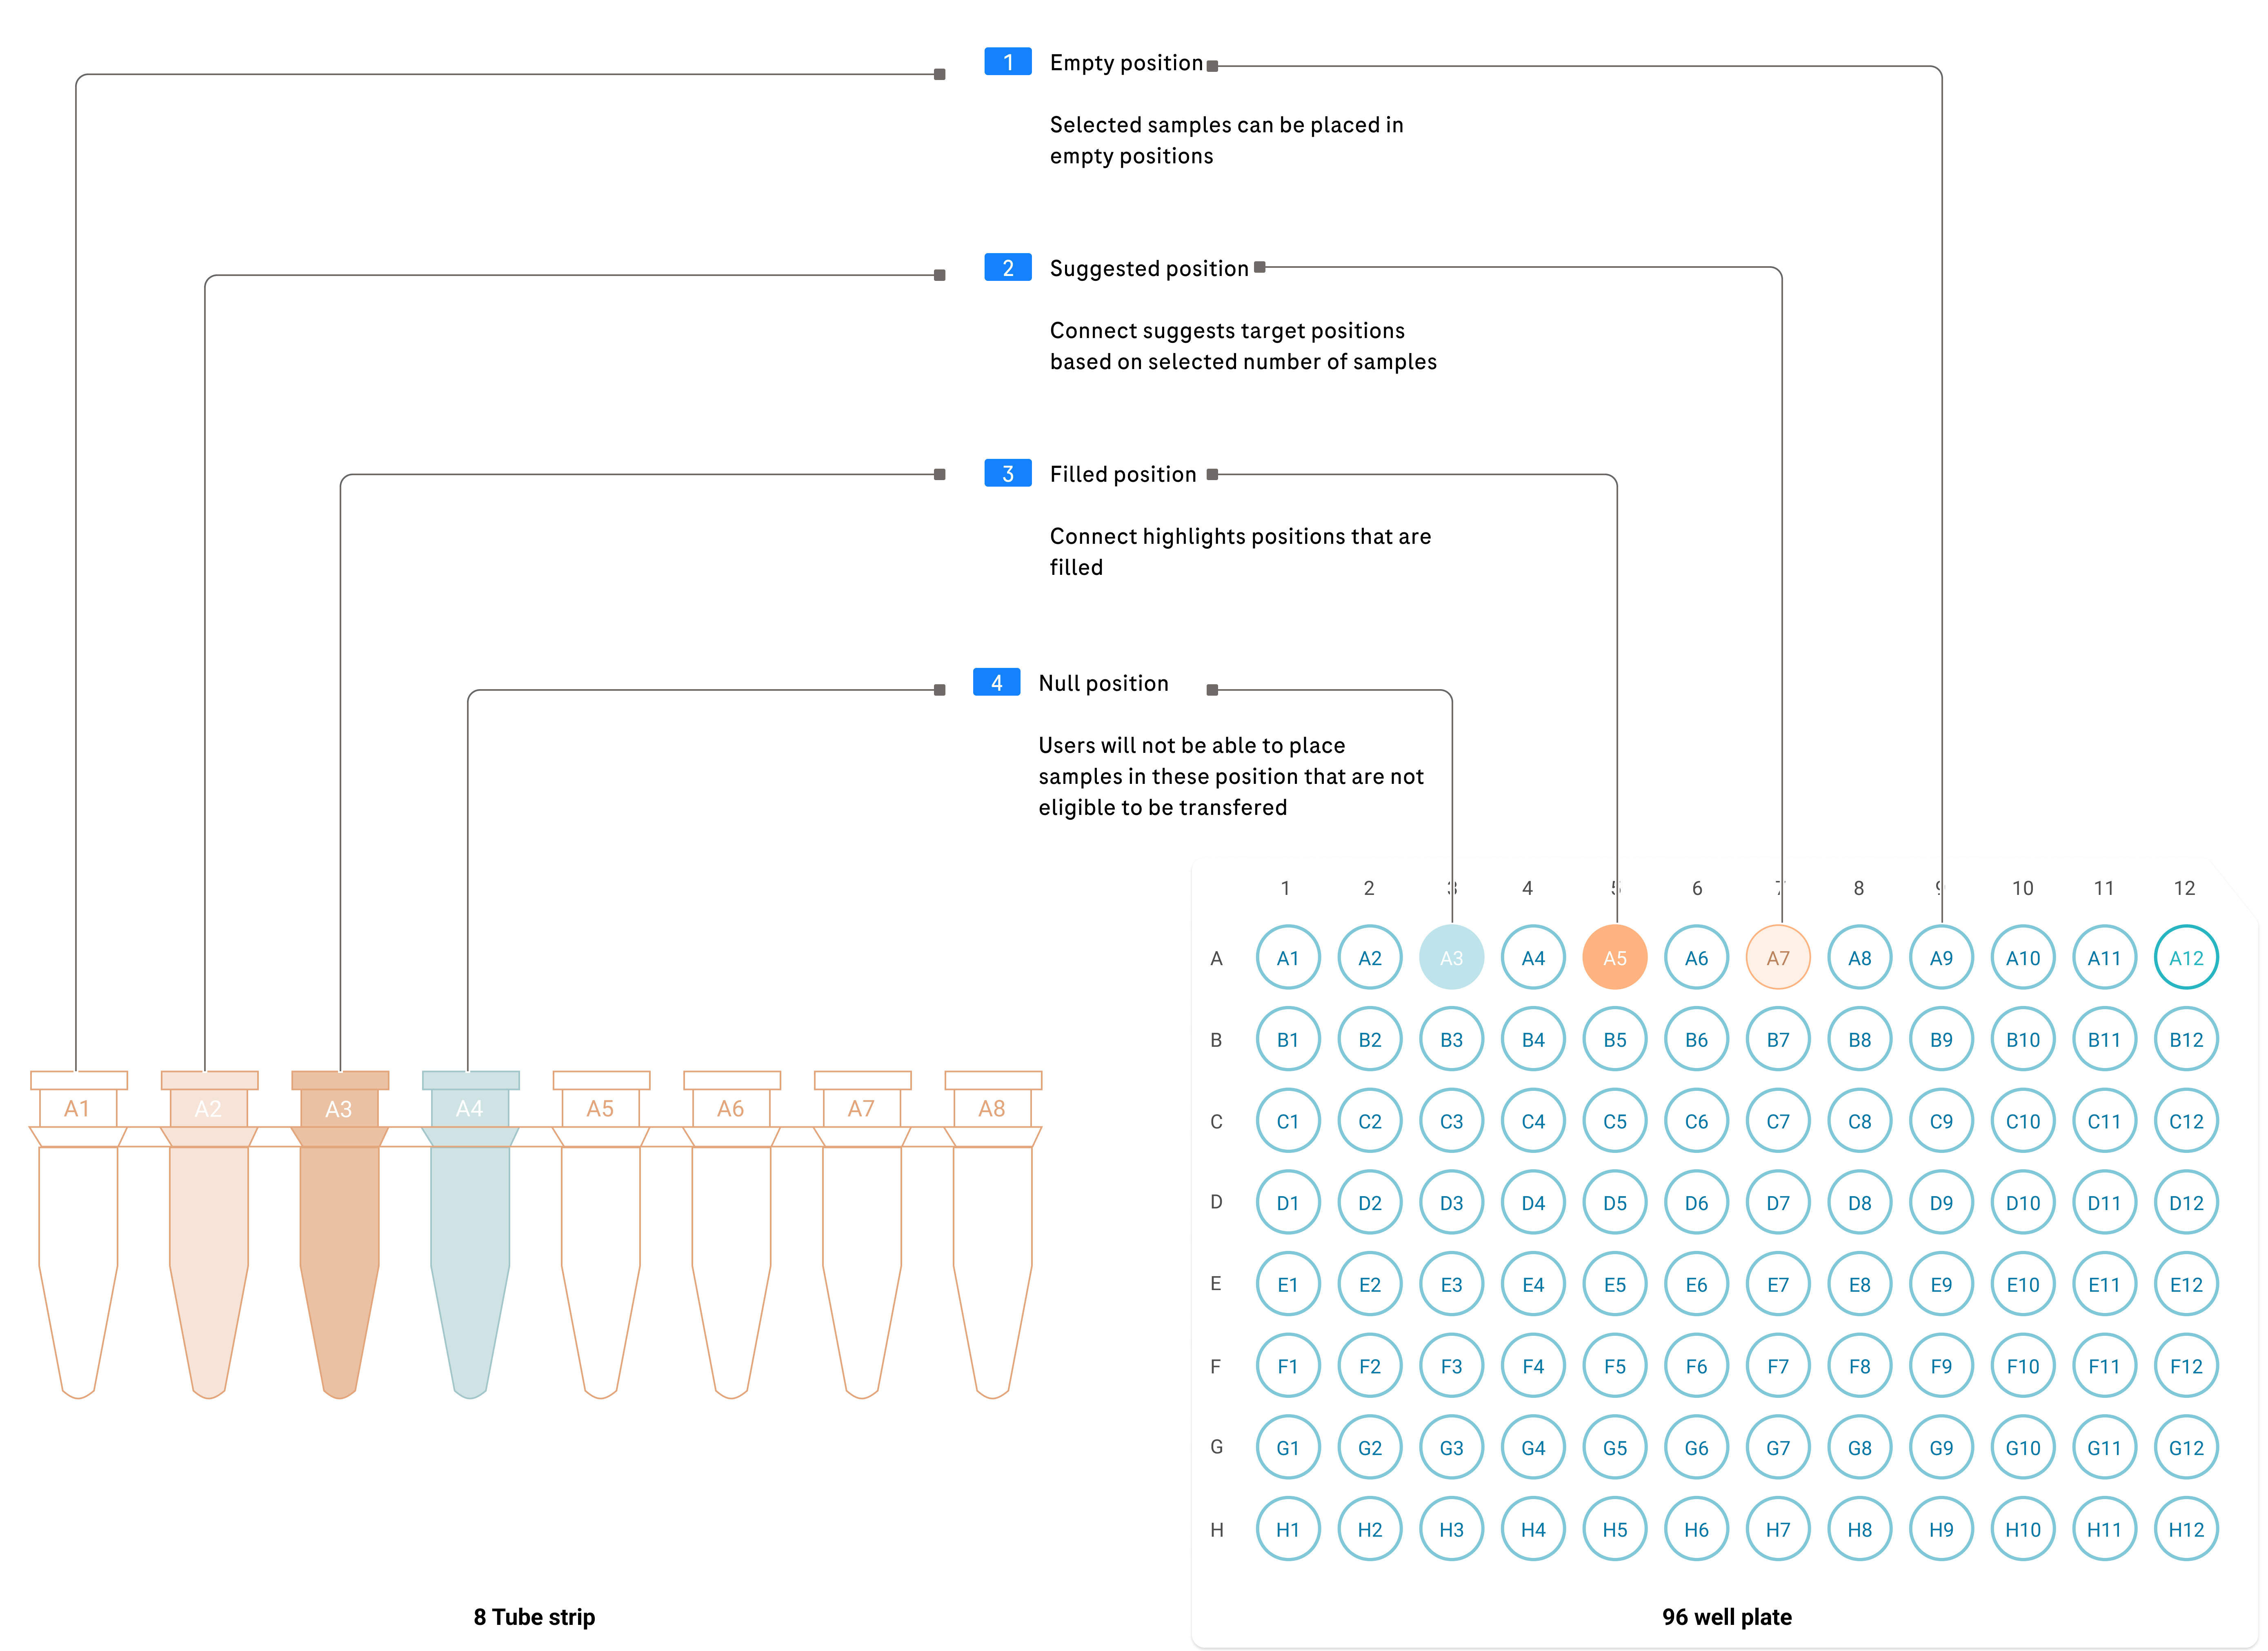
Target containers
We were dealing with two types of containers: a 96-well plate (a flat tray with 96 small wells arranged in a grid) and an 8-tube strip (a row of 8 individual tubes). For each container type, we needed to clearly indicate position status: empty, suggested, filled, and unavailable.
Pipetting orientation
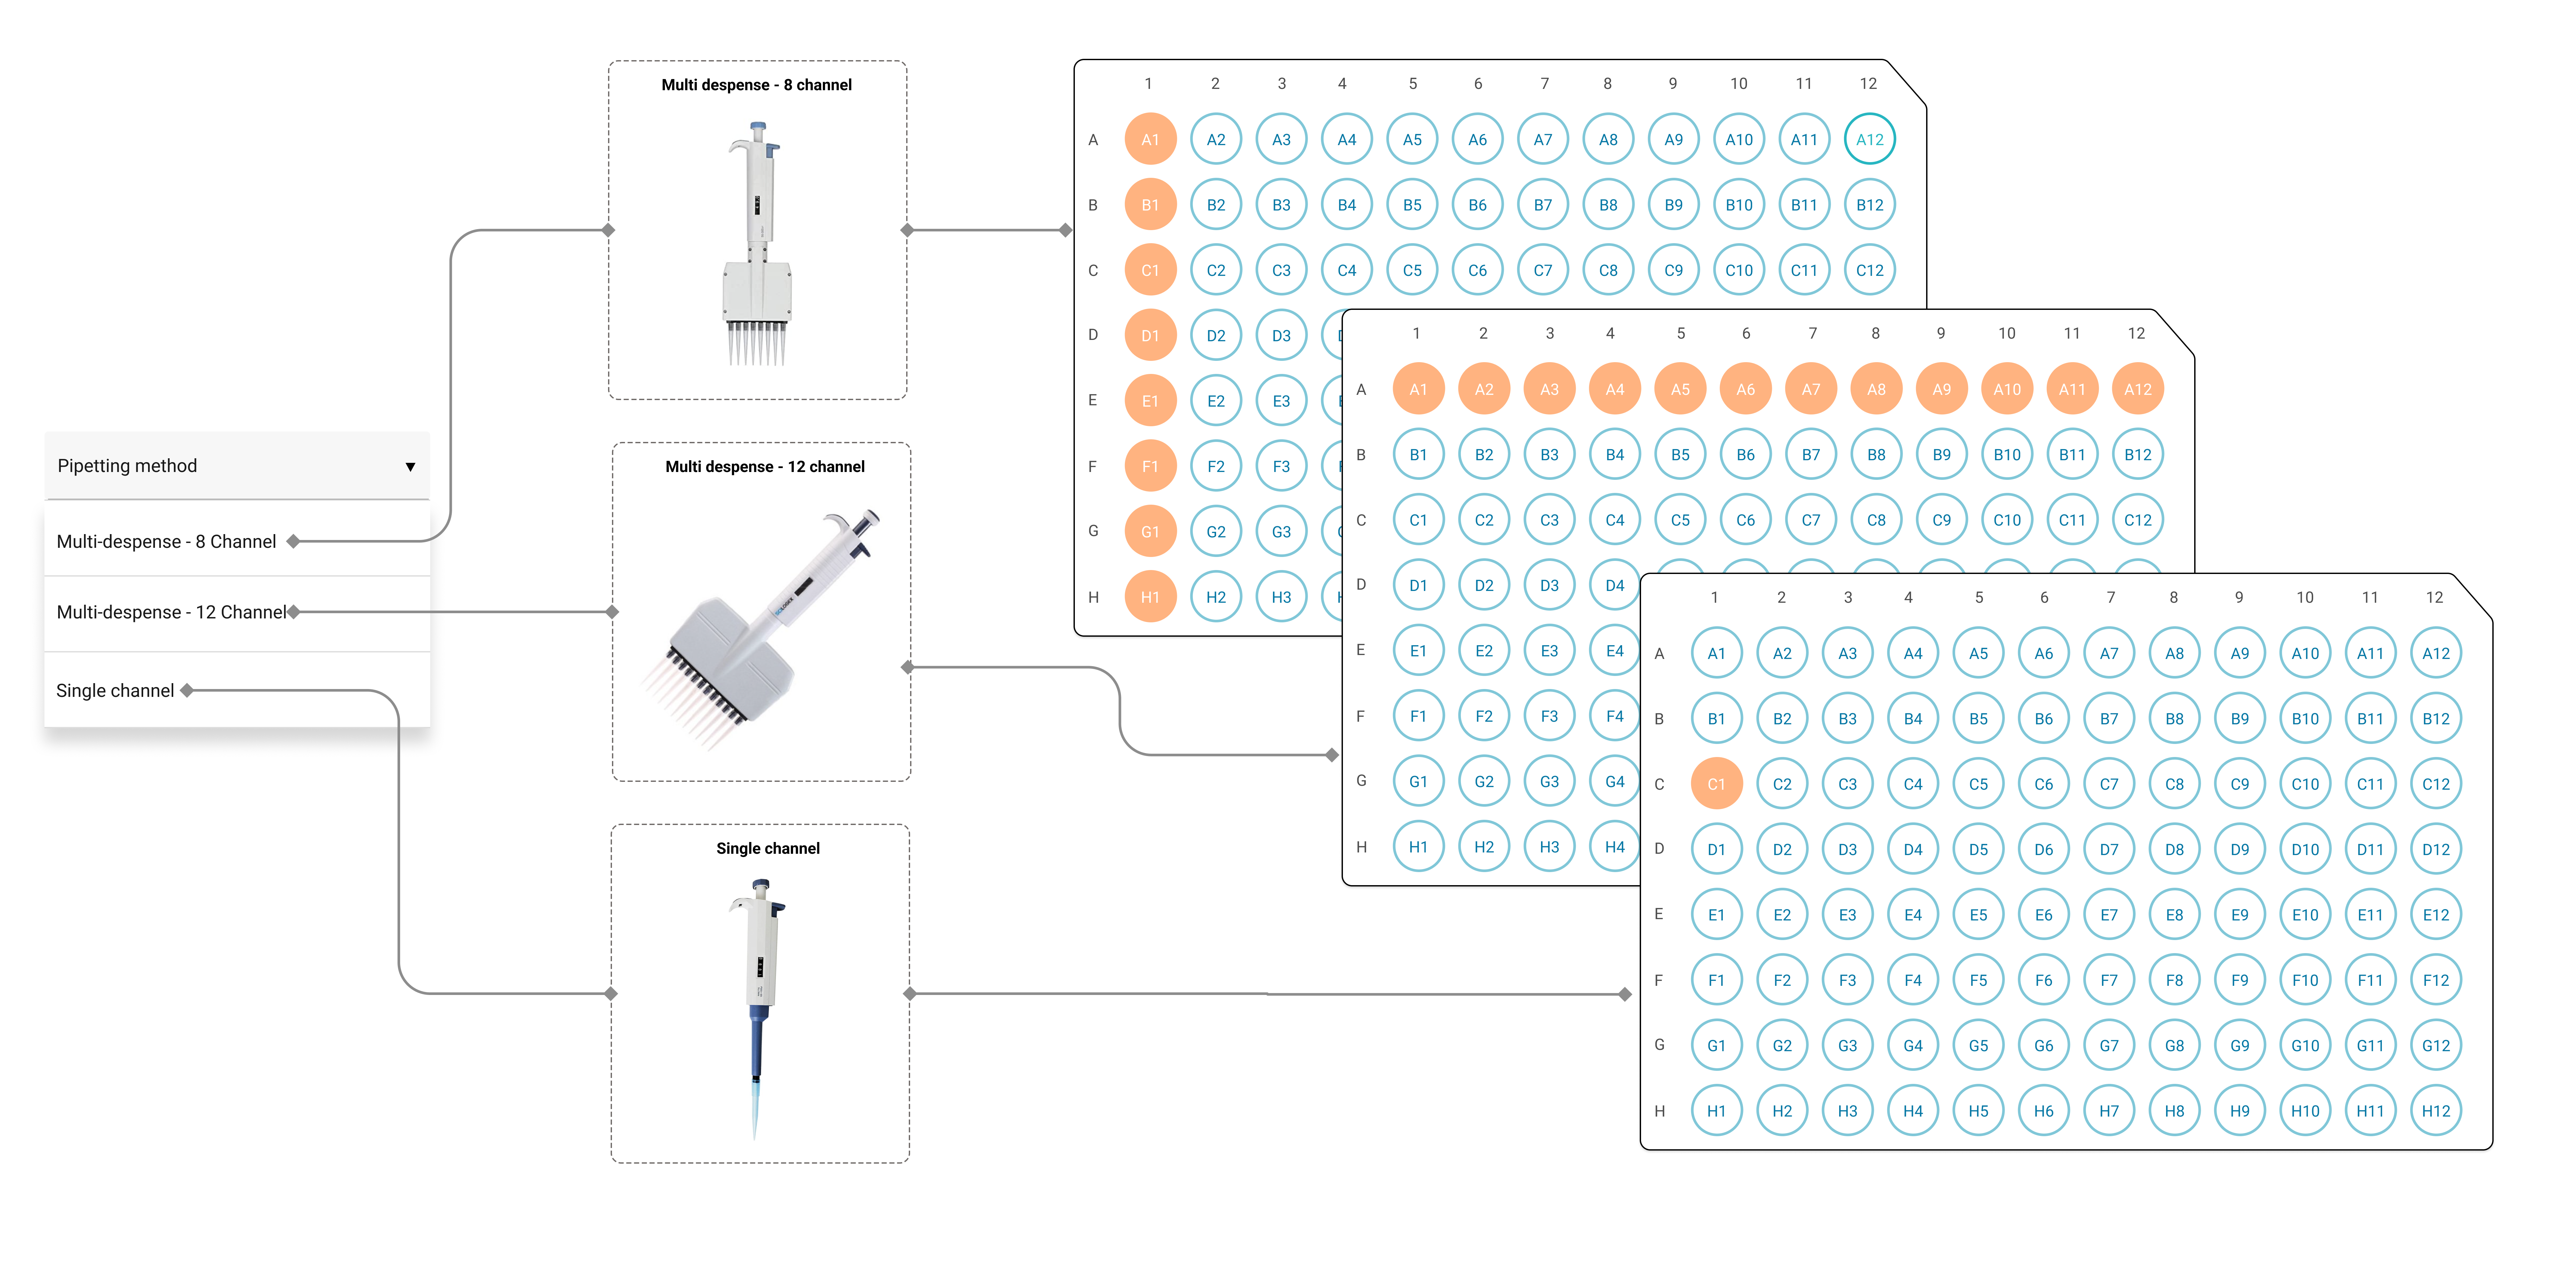
Technicians use different pipetting methods: multi-channel dispensing (transferring 8 or 12 samples at once using a multi-tip instrument) and single-channel (one sample at a time). The 8-channel pipettes place samples vertically, while 12-channel pipettes place them horizontally. The design allows users to choose their method, and the system adapts the recommended target positions accordingly.
Sample visualizer
The sample visualizer is the core of the transfer experience. It provides a real-time visual representation of both source and target containers, highlighting the active transfer step and guiding the technician through each pipetting action with clear visual cues.
Validation & Testing
A formative usability test was conducted with 3 lab technicians to gauge their mental model against the design. This allowed us to validate how we translated user interview learnings into the interface. Technicians performed actual pipetting tasks while following the on-screen guidance in a simulated lab environment.
The testing surfaced actionable feedback that directly shaped the final design. One key addition was sample-level comments for noting input volumes, concentration, and buffer details, which became one of the most-used features in the shipped product.
From design to product
The designs were handed off to development and shipped as a feature within AVENIO Connect. The final interface consolidates all research insights into a single-screen transfer experience that mirrors the technician's physical workspace.
Results & Impact
We observed 12 sample transfer sessions across the manual process (spreadsheets and physical tracking) and the visually guided approach in AVENIO Connect. Three metrics told the story.
Batch transfer time
The most immediate improvement was speed. With the manual process, a single batch of samples took an average of 2.5 hours to transfer. Technicians spent most of that time cross-referencing spreadsheets, verifying positions, and double-checking their work. With visual guidance, the same batch took 34 minutes.
Pipetting error rate
The core problem we set out to solve was mis-transfers: samples placed in the wrong wells. In the manual process, 2 out of every 10 batches had at least one wrong pipetting event. With AVENIO Connect recommending target positions and tracking progress in real time, the error rate dropped to 0.25%.
Interruption recovery
Remember the user quote about losing track after an interruption? That was a 25-minute problem. Technicians had to identify where they stopped, re-verify all completed transfers, cross-check their notes, and restart from a verified position. With AVENIO Connect, progress is saved automatically. Recovery takes less than 2 minutes.
Other notable improvements
- Spatial model validated. The left-to-right source-target layout matched the users' physical workspace exactly, requiring zero learning curve.
- Step-by-step approach preferred. Users strongly preferred the guided sequential transfer over seeing all transfers at once, reporting significantly lower cognitive load.
- Pipetting orientation clarity. Clear indication of row vs. column pipetting direction eliminated confusion about transfer sequences.
- Comments feature was a surprise hit. The sample-level comments added from testing feedback became critical for tracking concentration and buffer details.
Reflection & Learnings
The left-to-right spatial model was the single most important design decision. It came directly from observing how technicians arrange their physical workspace, and it meant the interface felt familiar from day one. Users didn't need to learn a new mental model; they just transferred their existing one to the screen.
Testing with real pipetting tasks revealed what mockups couldn't. The sample-level comments feature, which became one of the most-used features in production, only surfaced because technicians were performing actual transfers during testing. If we had only done screen-based walkthroughs, we would have missed it entirely.